DATA VISUALIZATION
DATA VISUALIZATION
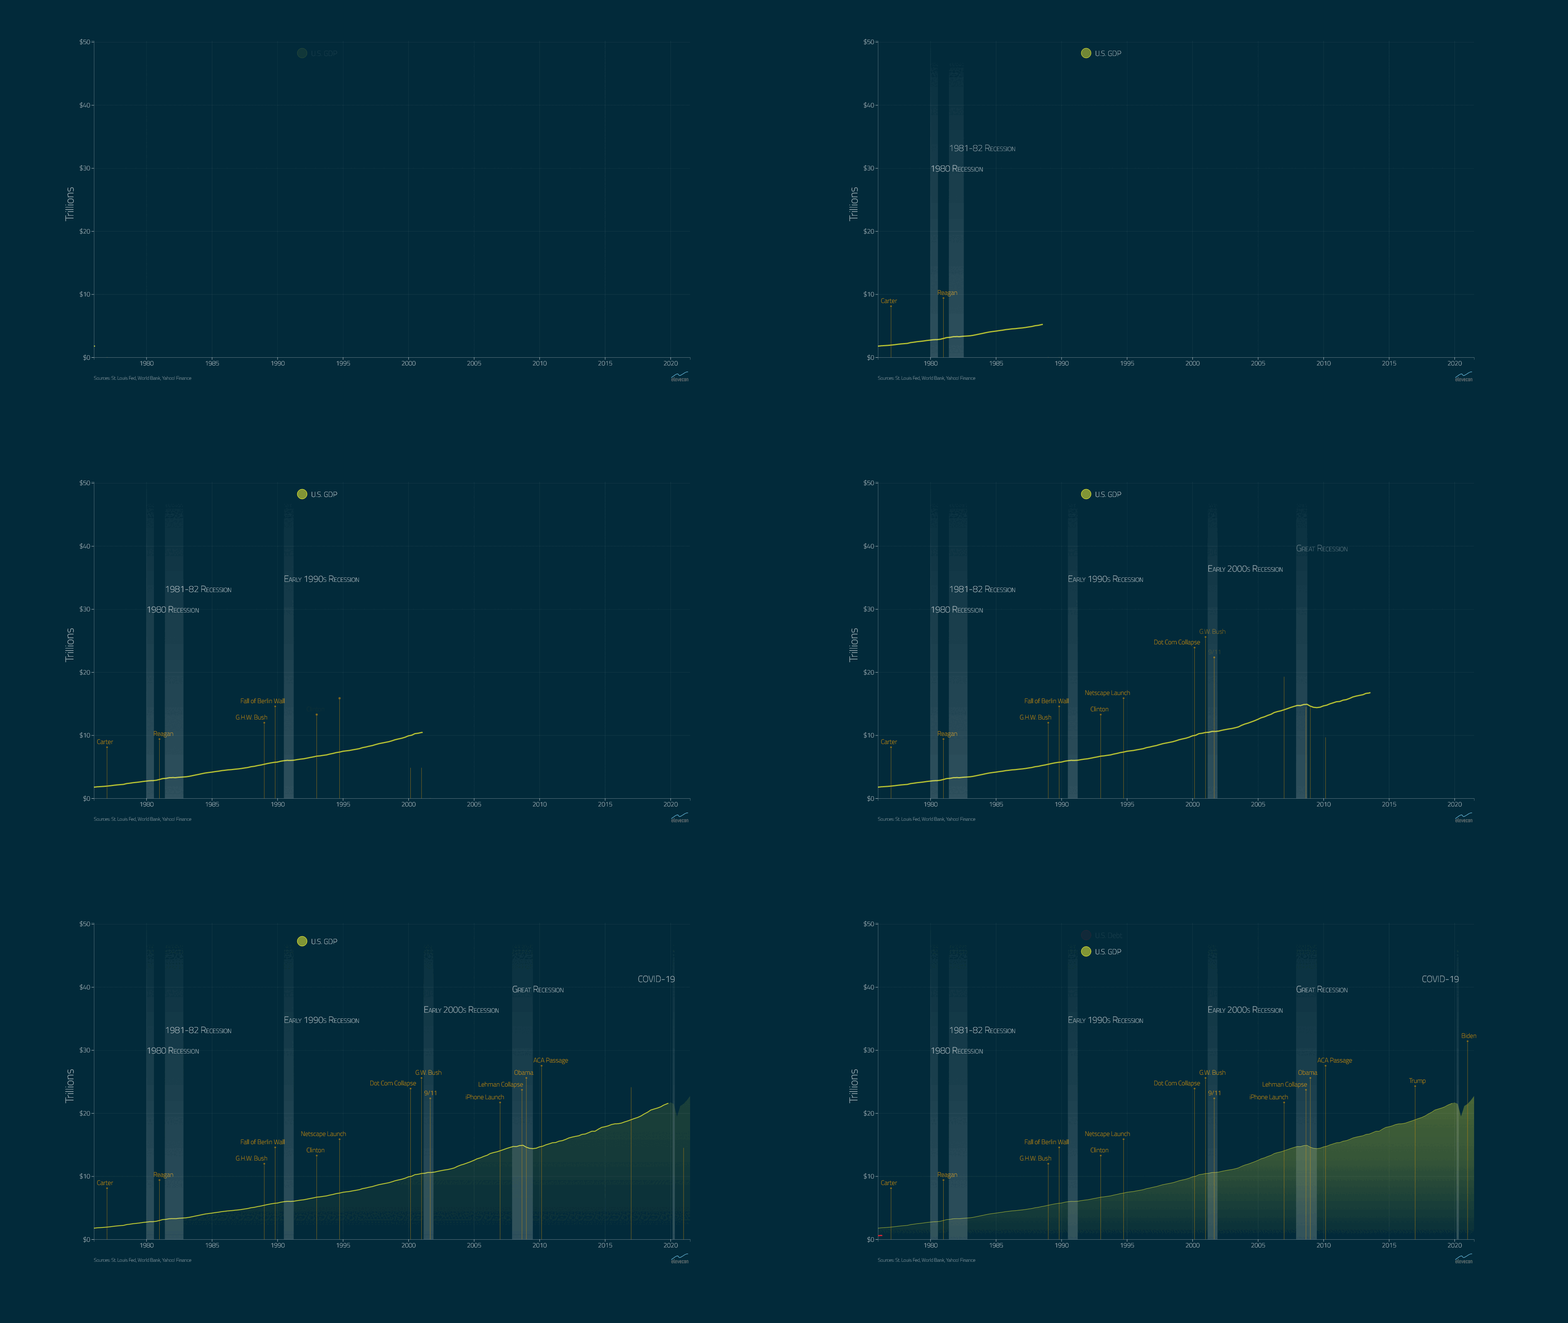
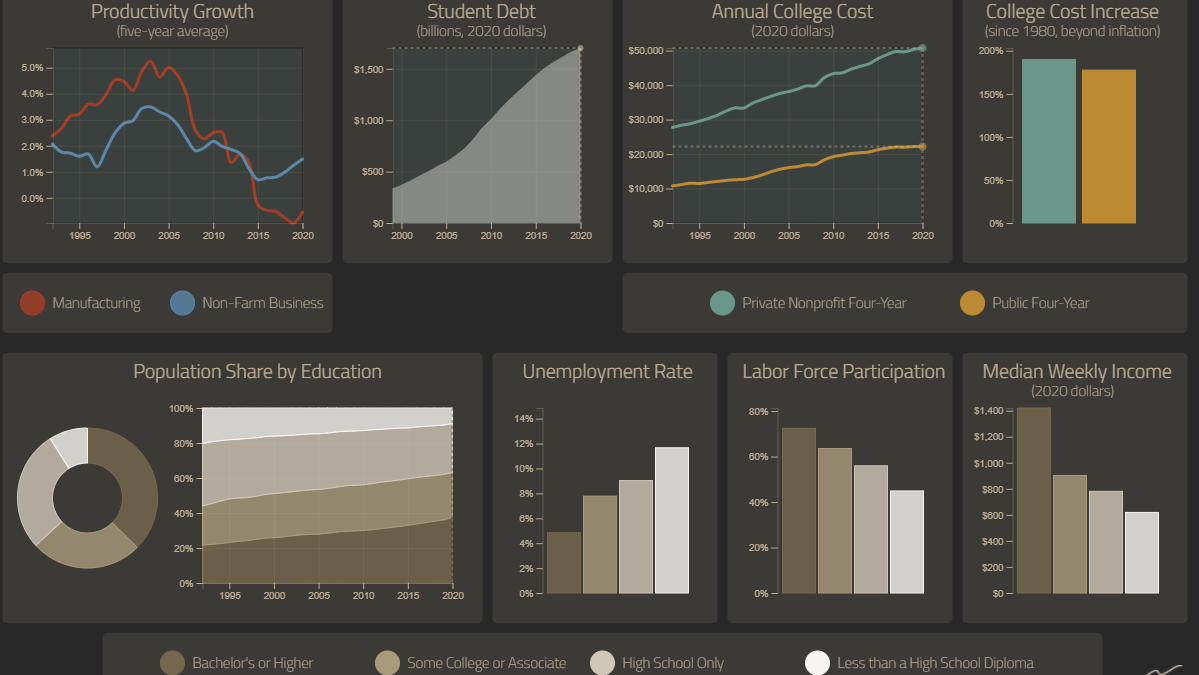
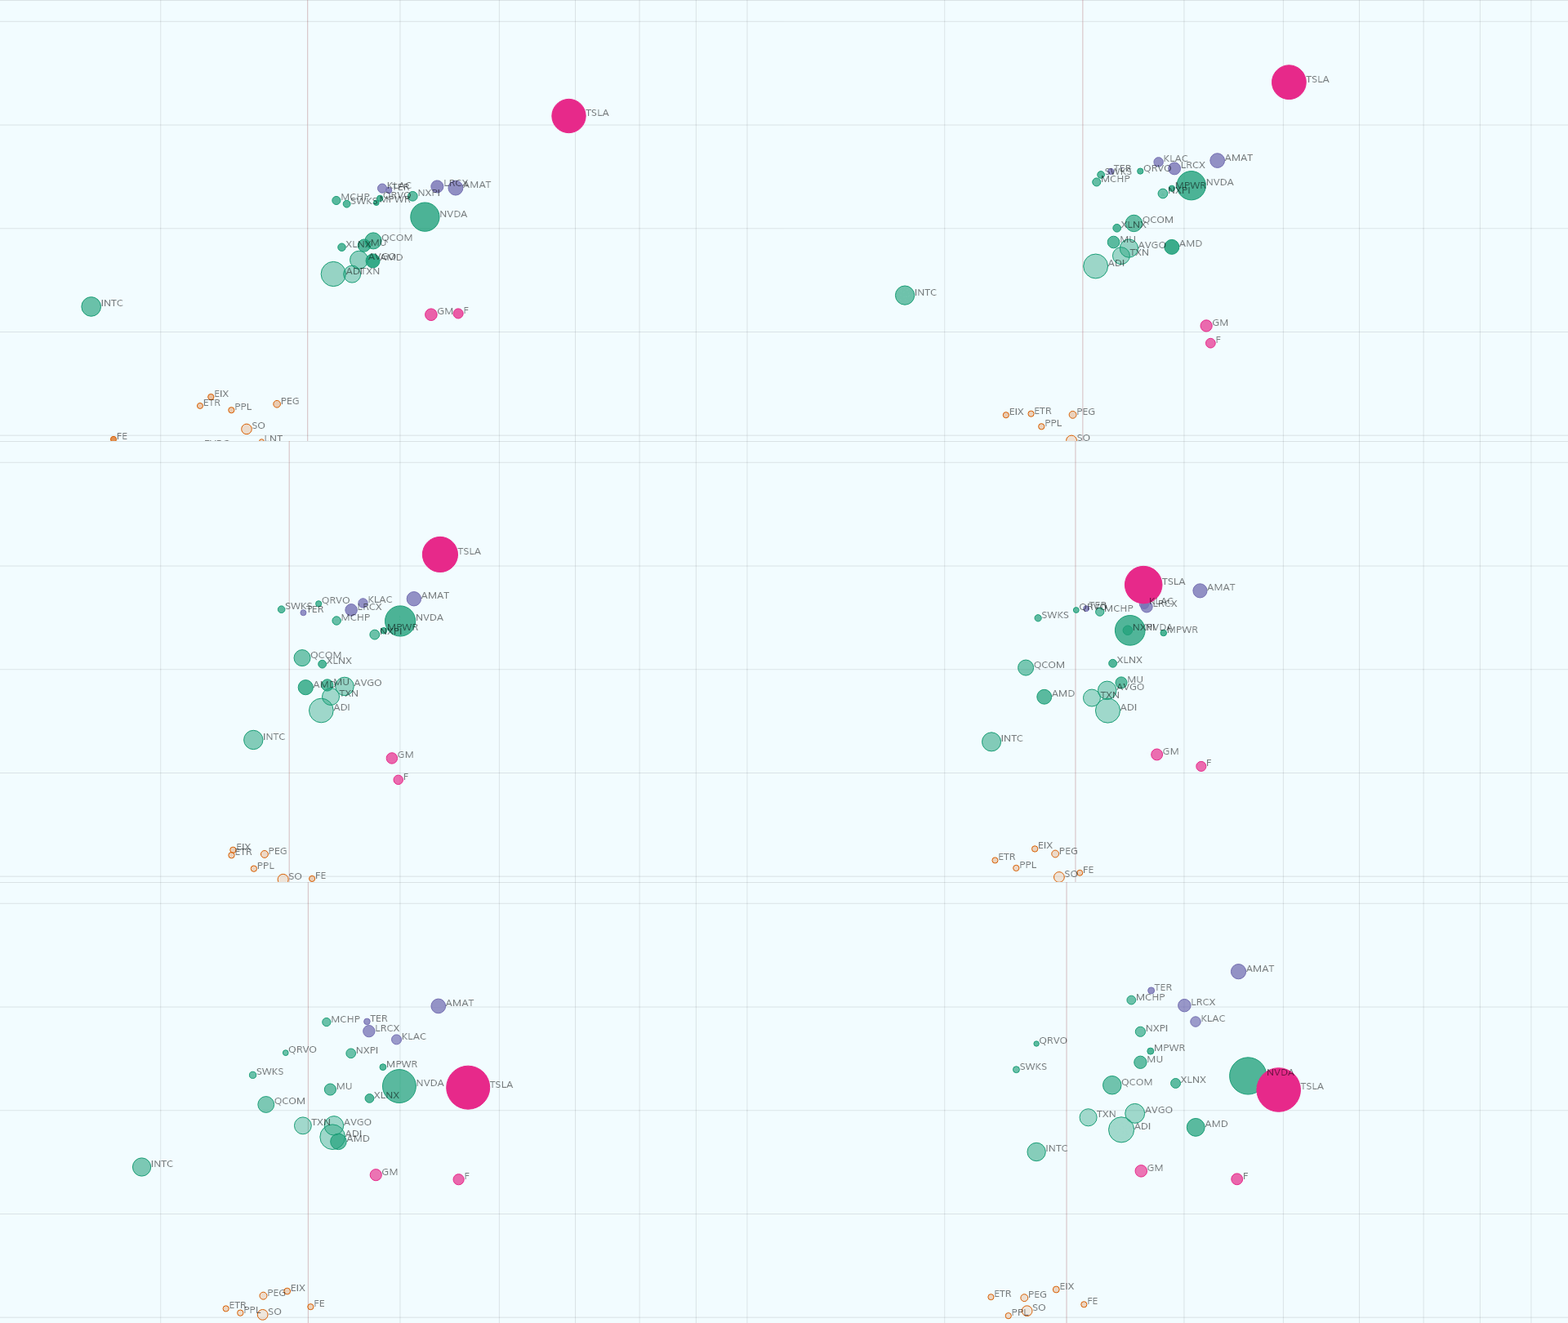
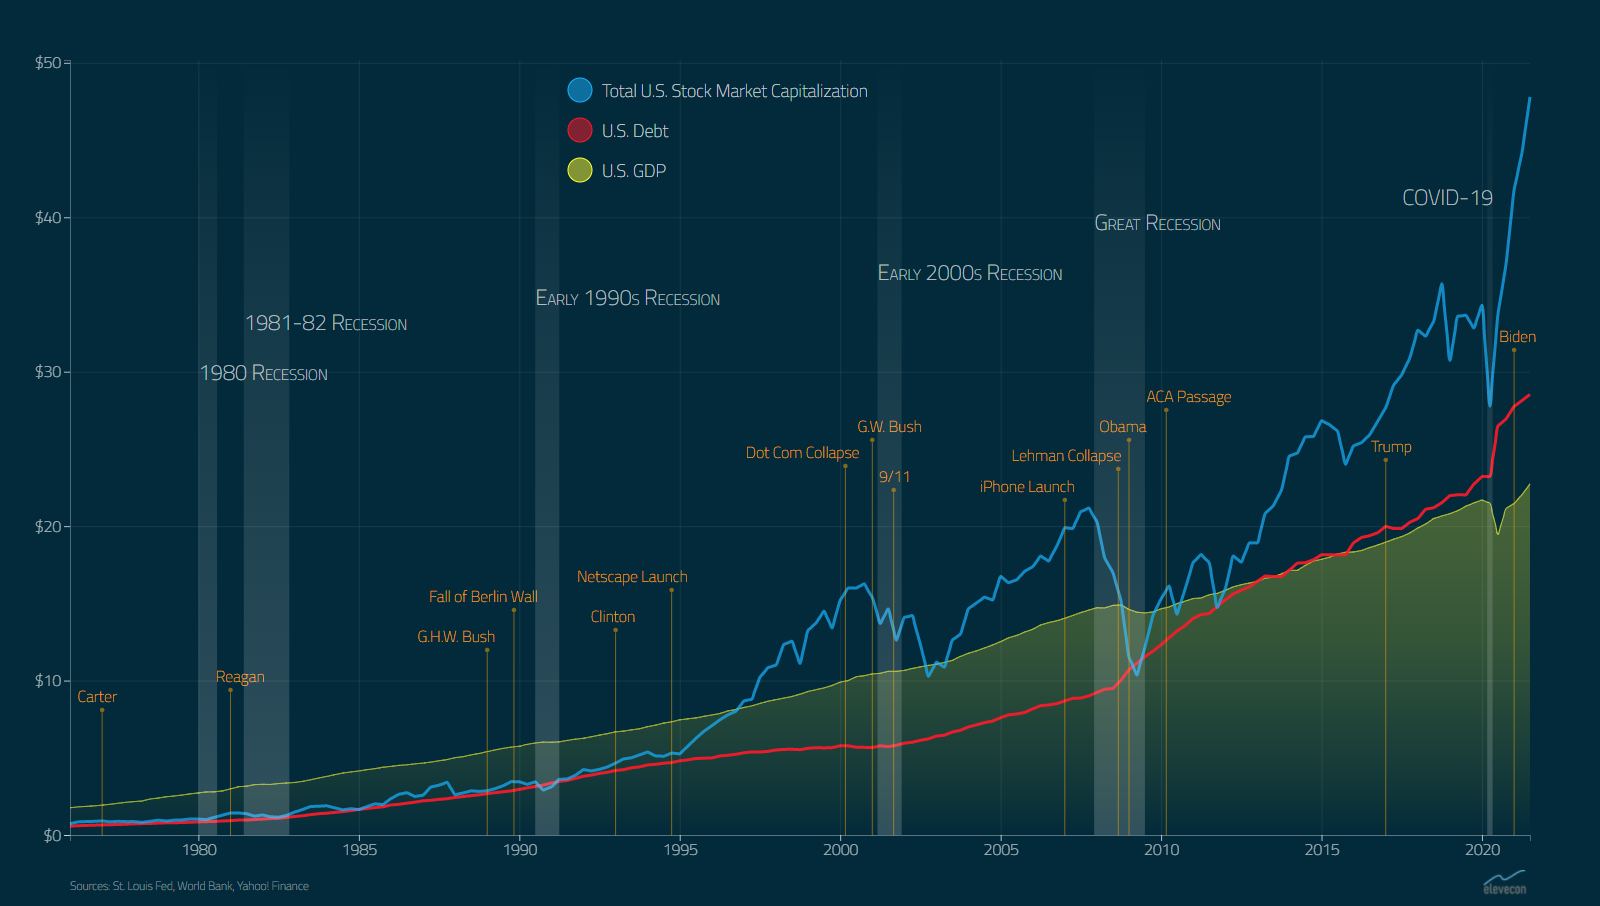
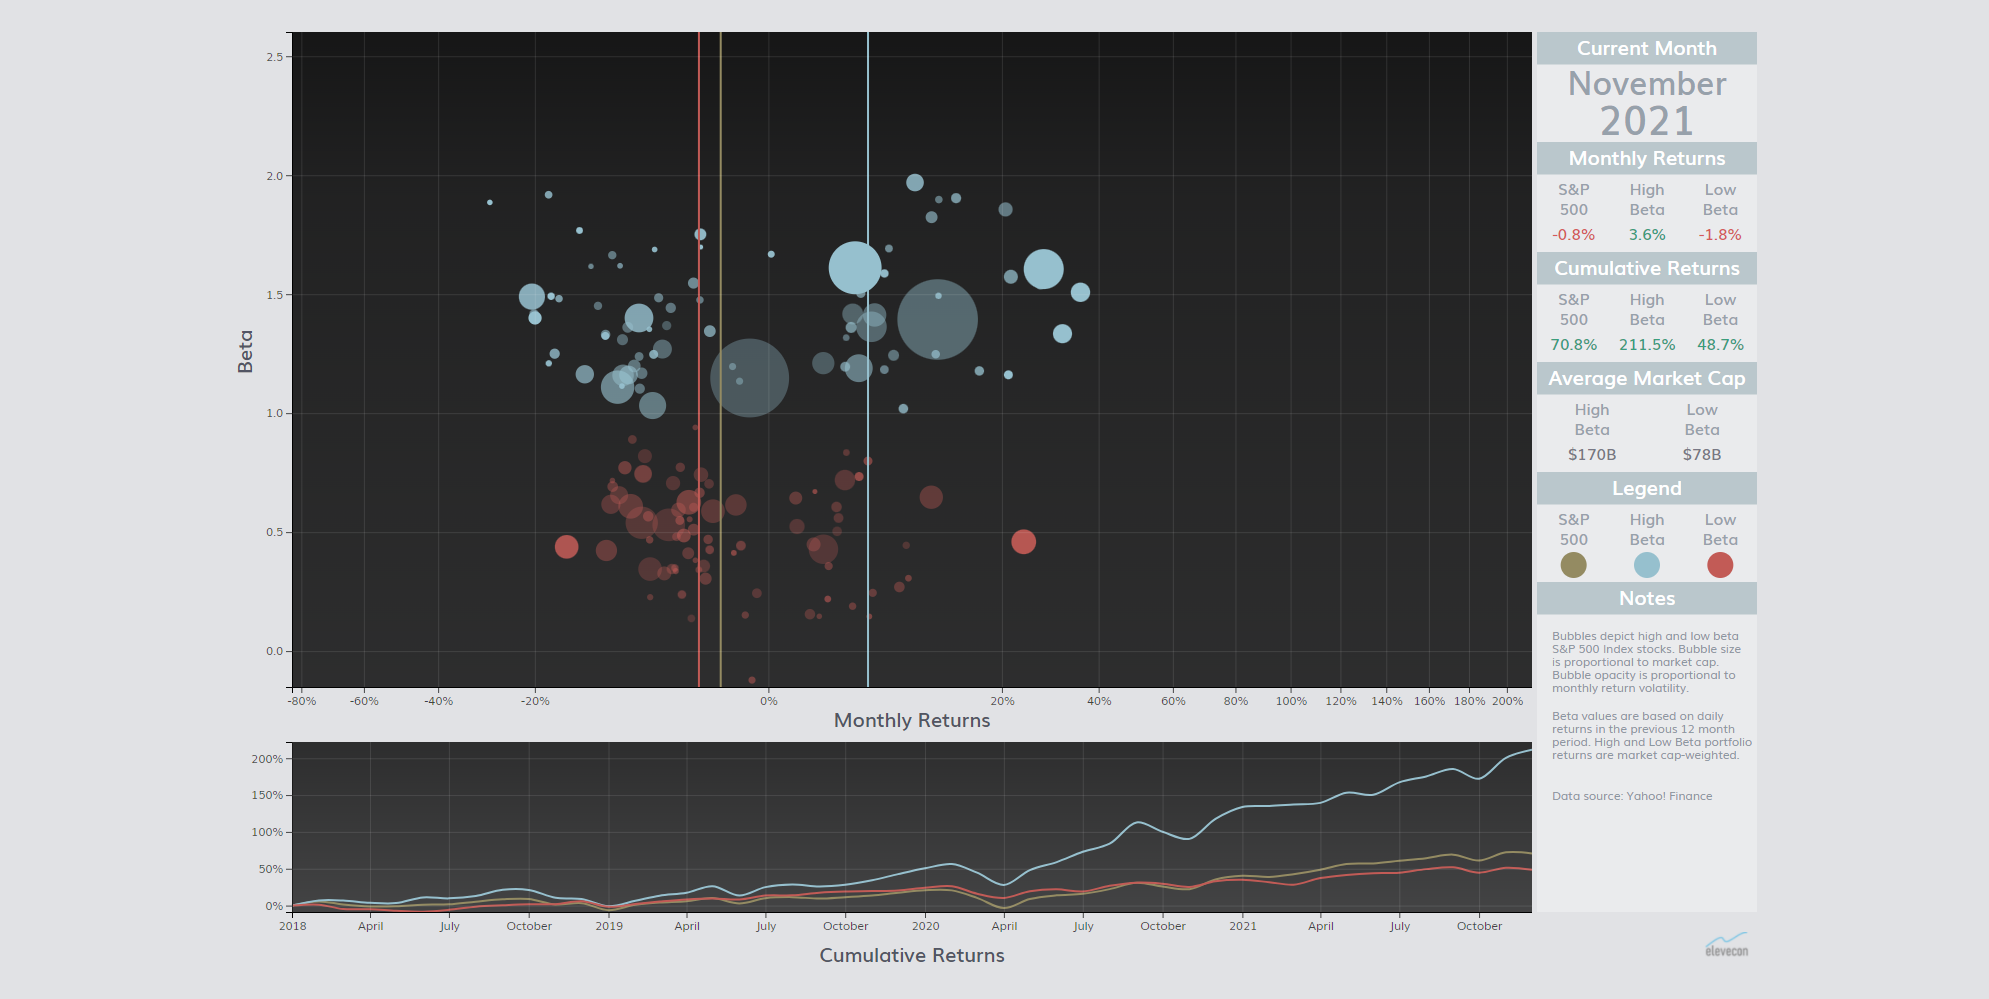
Visual consumption of data gives viewers an intuitive feel about the institutions, systems, and processes captured in the data, revealing insight and nuance not otherwise apparent. Data visualization can enhance the viewer’s understanding of data analysis by drawing attention to specific relationships between variables. It is a particularly effective method in persuading courts, policy makers, politicians, customers, and investors to choose a specific course of action.
We offer data visualization solutions for a variety of applications, including investigations, risk assessment, marketing strategy, trial exhibits, policy advocacy, expert testimony, business communication, and financial analysis.
SERVICES
Our data visualization services complement our economic consulting services. We work with clients to identify and acquire datasets to help answer difficult questions of interest. We analyze data and use visualization to enhance analysis and to increase its persuasive power.

Advocacy & Business Communications
We create customized visualizations to achieve greater persuasive impact and more effective advocacy.

Analytic Solutions
We provide comprehensive data visualization solutions for better visual assessment of complex datasets.

Research & Shareable Communications
We help clients achieve greater research efficacy through user engagement and data sharing.
